Monthly Economy & Travel Industry Summary: September 2024

Federal Reserve Cuts Interest Rate in Response to Slowing Inflation and Hiring
While our call in April that the Federal Reserve would begin cutting rates in September got the timing right, we were wrong about the size of the rate cut, as the Fed opted for a larger 50bp reduction to kick off the easing cycle.
The incoming inflation data and signs of deterioration in the labor market not only shifted the ground for rate cuts but also had an outsize impact on Fed officials’ perceptions of those risks. After focusing on the upside risks to inflation for much of the past few years, the September policy statement said, “the risks to achieving [the] employment and inflation goals are roughly in balance.”
Our new forecast for the fed funds rate adds a 25bp cut at the November meeting in addition to the previously forecasted 25bp cut in December. However, given officials’ sensitivity to labor market weakness, the possibility of a larger 50bp cut in November cannot be ruled out. Fed officials will receive the September and October employment reports before their November gathering. Additionally, they will review incoming data on initial claims for unemployment insurance benefits as well as the hires rate and job vacancy ratio from the Job Openings and Labor Turnover Survey. Unexpected softness in any of those reports could move the needle on the Fed’s next move.
Looking ahead, we anticipate the Fed will approve a rate cut at every other meeting next year and in 2026 until it reaches the long-run neutral rate of 2.75%, which will occur a touch earlier than previously thought.
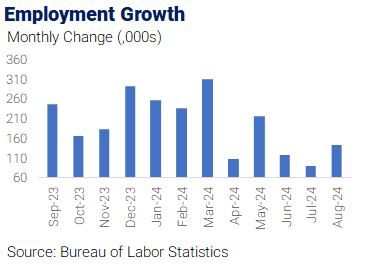
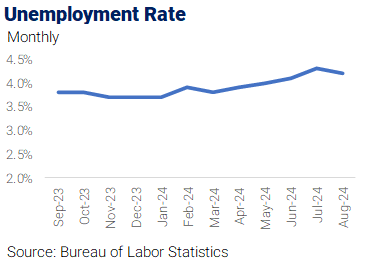
The Federal Reserve’s actions are intended to preempt an acceleration of the slowdown in the labor market. The unemployment rate was 4.2% in August, versus 3.7% at the beginning of the year. Additionally, the hiring rate has been below the 2018-2019 average (3.8%) every month this year. After dipping to 3.3% in June, the hiring rate ticked up to 3.5% in July.

However, labor market conditions reflect a slowdown rather than a collapse. Layoffs have shown no sign of accelerating all year and remain below the pre-pandemic average. Therefore, the recent rise in unemployment can be attributed to slower hiring in combination with an increase in labor force participation rather than permanent layoffs.

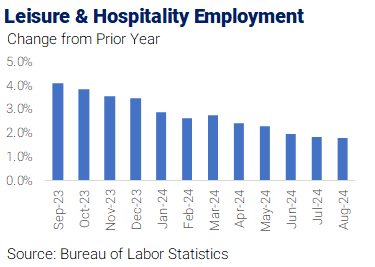
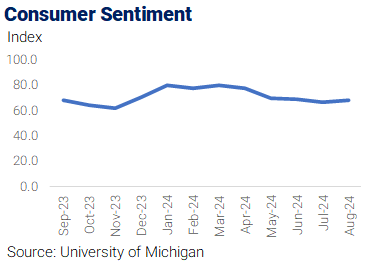
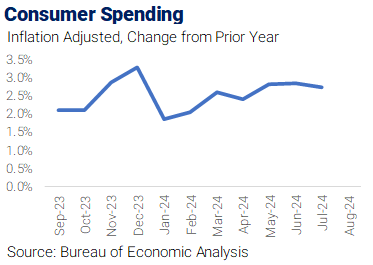
Even though job growth is slowing, consumer spending is being bolstered by healthy employment levels and gains in real disposable income as wage growth outpaces the slowing rate of inflation. Real income growth and healthy household balance sheets should support solid growth in consumer spending over the rest of the year.
The current situation illustrates the circular relationship between consumer spending and labor markets. Layoffs are unlikely as long as consumer spending doesn’t falter, and consumer spending is less likely to falter without an increase in layoffs.
What’s more, for all the signs that low-income consumers are struggling, the risks of that weakness migrating up the income spectrum appear low. Middle- and higher-income households have experienced considerable wealth gains since the pandemic, mainly reflecting the surge in housing equity.
With homeowners sitting on $35 trillion of housing equity, there is a formidable pool of equity extraction on tap to support spending even as labor conditions continue to cool. There is some risk that, as interest rates begin to fall, consumers tap enough of that equity to fund consumption to an extent that slows inflation’s retreat.
One clear downside risk to the sanguine outlook for labor markets is that the strike activity at Boeing could knock the employment data off course. Close to 30,000 machinists walked out on September 12, and Boeing announced the potential furloughing of “tens of thousands” of white-collar workers to conserve cash beginning in late September. The overall impact could be close to 50,000 workers and will be a hit to October payrolls if the strike lasts into mid-October.
There is also the threat of a walkout of 45,000 East and Gulf Coast port workers when their contract expires at the end of this month. The impact of both strikes is a large downside risk to the October employment report.
Travelers Benefiting from Slower Growth in Travel-Related Prices
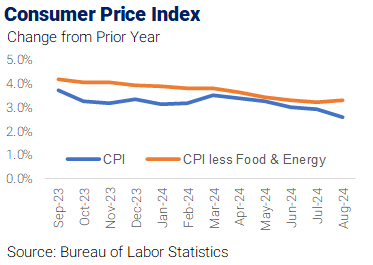
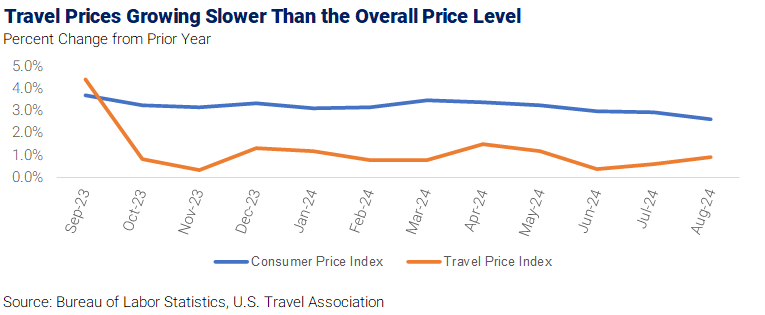
The pace of inflation has slowed considerably over the past year, and growth in prices for travel-related goods and services has experienced an even more pronounced slowdown. Year-over-year growth in the Travel Price Index has been less than one percent for three consecutive months and has grown less than the Consumer Price Index every month.
The Travel Price Index, reported by the U.S. Travel Association, aggregates prices in several travel-related categories to approximate growth in the overall cost of travel. Travel prices rose 0.9% in August versus 2.6% growth in the Consumer Price Index.
Several factors have contributed to the slowdown in travel prices. Most notably, airfares are falling after spiking during the initial resumption of travel after the pandemic. The airline fares component of the Travel Price Index has posted year-over-year declines for 17 consecutive months.
Lower fuel prices have also contributed to slower TPI and CPI growth. The monthly average price per gallon for diesel fuel and regular unleaded has decreased for more than a year.

The average daily rate for a hotel room hasn’t declined like airfares, but hotel rates are growing much slower than in recent years. The average daily rate, through August, was up 1.7% versus the same period last year. For comparison, ADR rose more than 4% in 2023 and 20% in 2022.
Although growth in the Travel Price Index has slowed notably over the past year, some components of the index continue to post solid gains. Food prices were up 4% in August versus the same month last year, and prices for recreation services were up a similar amount.
The reduction in travel price inflation, along with growth in consumer spending thanks to real wage growth and healthy household balance sheets, are contributing to solid growth in the travel industry. The number of passengers going through TSA checkpoints in US airports, international travel by US residents, and cruise passenger volumes are at all-time highs.


The Monthly Economy & Travel Industry Summary partners with Tourism Economics, an Oxford Economics company. Combining rigorous economic analysis with decades of travel industry expertise, Tourism Economics is an industry-leading insight resource. Learn more at www.tourismeconomics.com.
